Like many Type 1 Diabetics, I have a treasure trove of person data from my insulin pump, CGM and apple watch. Every six months, I meet with my endocrinologist to review my glucose trends and adjust my insulin pump profiles. I want to make it easier to analyze my own data and make adjustments between doctors visits. First, I downloaded my data and combined them into a single dataset. Next, I uploaded my data to ChatGPT and began asking questions.
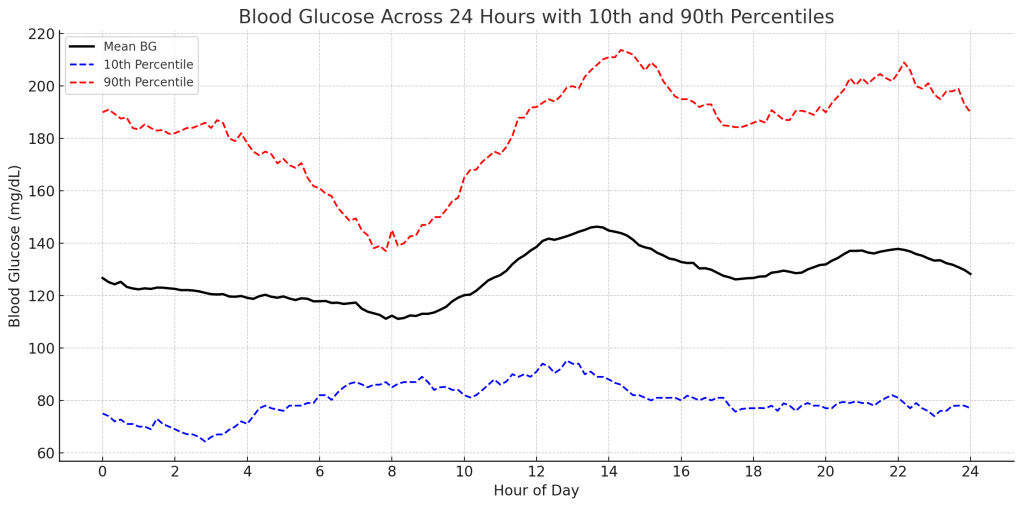
I started by asking to show daily trends with average, 90th percentile and 10th percentile lines. This is similar to what I go over with my Endocrinologist, and it’s typically provided by the Tandem software. I can already see that I need to increase my pump’s basal rate and provide a more aggressive correction factor and carb ratio between 8am and noon. Let’s see if we can investigate further.
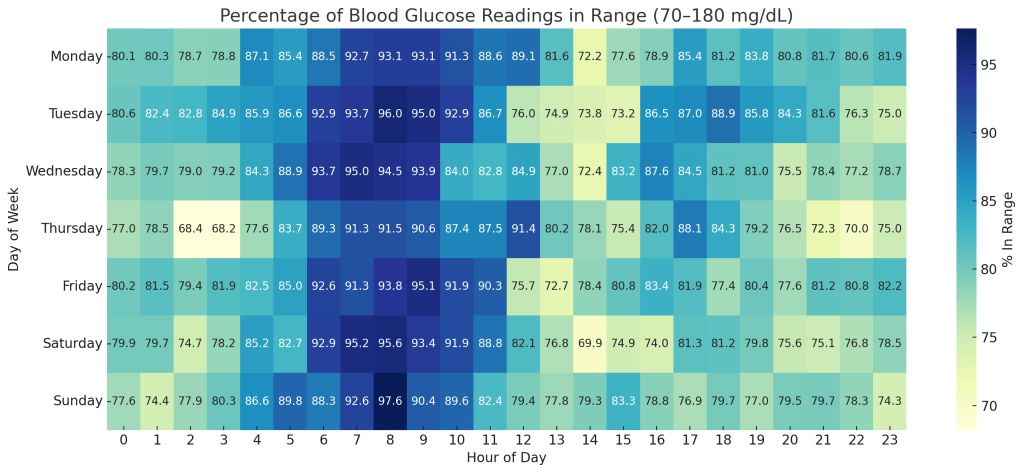
Next, I asked ChatGPT to tell me how often my blood glucose is in range across the day. The sample size here isn’t enormous (~2k samples per block), but it’s enough to draw some conclusions. Again, it’s clear that I have issues between 10am to 2pm. Also, late Wednesday night into Thursday morning, late Friday into Saturday and to a lesser extent Saturday into Sunday appear to be issues. Interestingly I sometimes play in an online poker group during those times – perhaps the combination of distraction, stress and disrupted sleep are responsible for these periods of glucose excursion. Perhaps I need to avoid midnight snacks and be more mindful of avoiding late nights when I’m playing poker.
The real power of creating a dataset like this becomes apparent when you want to start filtering the data. For example, I want to look at my glucose readings across the day but only for weekdays and only since the start of this year. It’s important to balance the desire to filter data with the need for enough data to generate a meaningful result. Here are a few charts I was able to come up with that have helped me.
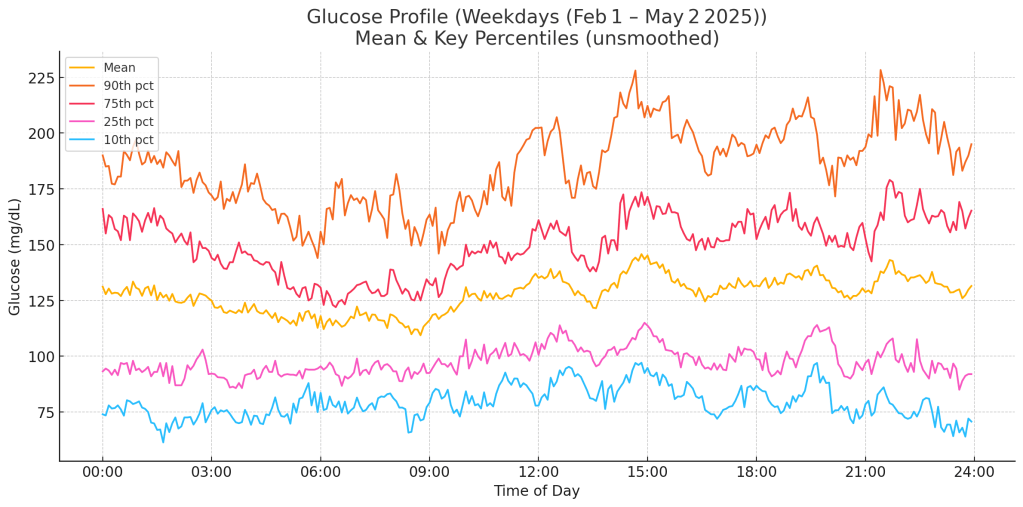

I notice a few interesting differences between weekdays and weekends. First, for some reason my dawn phenomenon (glucose rise after waking) seems to be much worse on weekends than weekdays. I speculate this is suppressed on weekdays because I’ve been going for a pre-work run almost every day during the week. Second, I often skip breakfast during the week but have more time to make breakfast on weekends, which could contribute to the glucose rise. Overall my weekends seem to have more glucose excursions, probably since my schedule varies more.
With all these data, I can start making insulin pump profile adjustments for myself. Here are my profiles before I started.
| Time Start | Basal | Corr Factor | Carb Ratio | Target BG |
| 12:00AM | 1.4 | 1:25 | 1:7 | 110 |
| 6:00AM | 1.6 | 1:22 | 1:6 | 110 |
| 10:00AM | 1.4 | 1:24 | 1:7 | 110 |
| 5:00PM | 1.4 | 1:24 | 1:7 | 110 |
I had trouble getting ChatGPT to generate meaningful and effective changes to my profiles – it kept recommending that I change things in its text responses while changing nothing in the table it gave back. I’ll tackle this later – with my trends clear to me, I’m able to make some changes manually. I decided to change the profile times to reflect trends since I last updated my profiles. Below is the profile I changed to. Notice the morning chunk with high insulin doses now starts at 8am and ends at 1pm. I also toned down the overnight insulin to prevent early AM hypoglycemia, and upped late day insulin to bring the averages down between lunch and dinner. The resulting profile is below.
| Time Start | Basal | Corr Factor | Carb Ratio | Target BG |
| 12:00AM | 1.2 | 1:25 | 1:8 | 110 |
| 8:00AM | 1.6 | 1:20 | 1:6.5 | 110 |
| 1:00PM | 1.5 | 1:21 | 1:7 | 110 |
| 5:00PM | 1.3 | 1:24 | 1:8 | 110 |
I’ve also decided to reduce my total daily insulin from 60 to 45 units due to recent dietary changes I’m making alongside my new pump regimen.
Every few weeks, I will re-upload my data and rerun some of these calculations. One of my goals is to streamline the process and share it so that others can do the same. Currently this requires some technical knowhow, but I’m hoping to make it easy enough that anybody can use these tools.

Leave a comment